Bug Report: "vs last month" delta is inverted / miscalculated ?
The number contradicts reality and undermines trust in the dashboard.
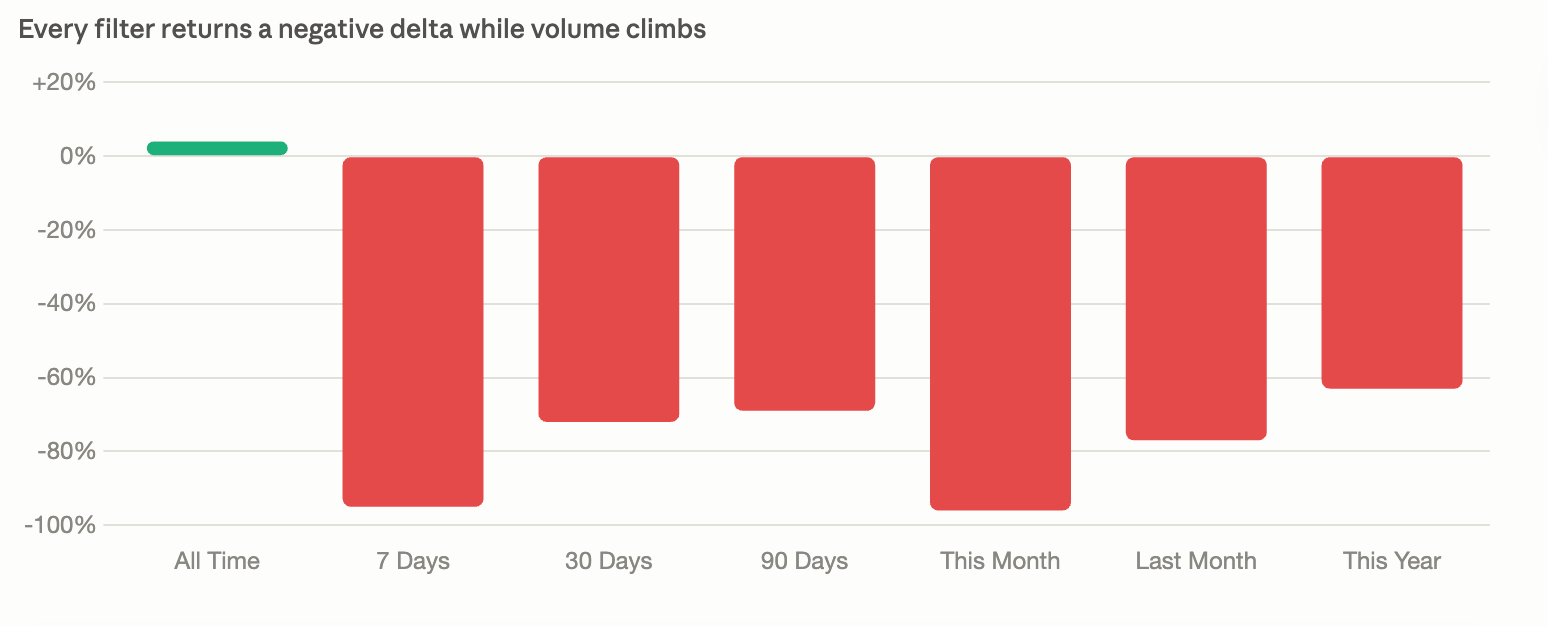
A new onboarded client (Salon le W /) flagged it during a review meeting: he collected far more reviews this month than last, yet every Time Period filter shows a large negative delta.
Likely cause
The current window counts only dated reviews (48 in 2026, avg 5.0), but the baseline seems drawn from the full All Time set (179, avg 4.6, inflated by undated imported Google reviews). A small numerator over a large baseline yields a negative percentage on every window. Not confirmed — a plain inverted sign or a wrong reference month would also fit.
Summary
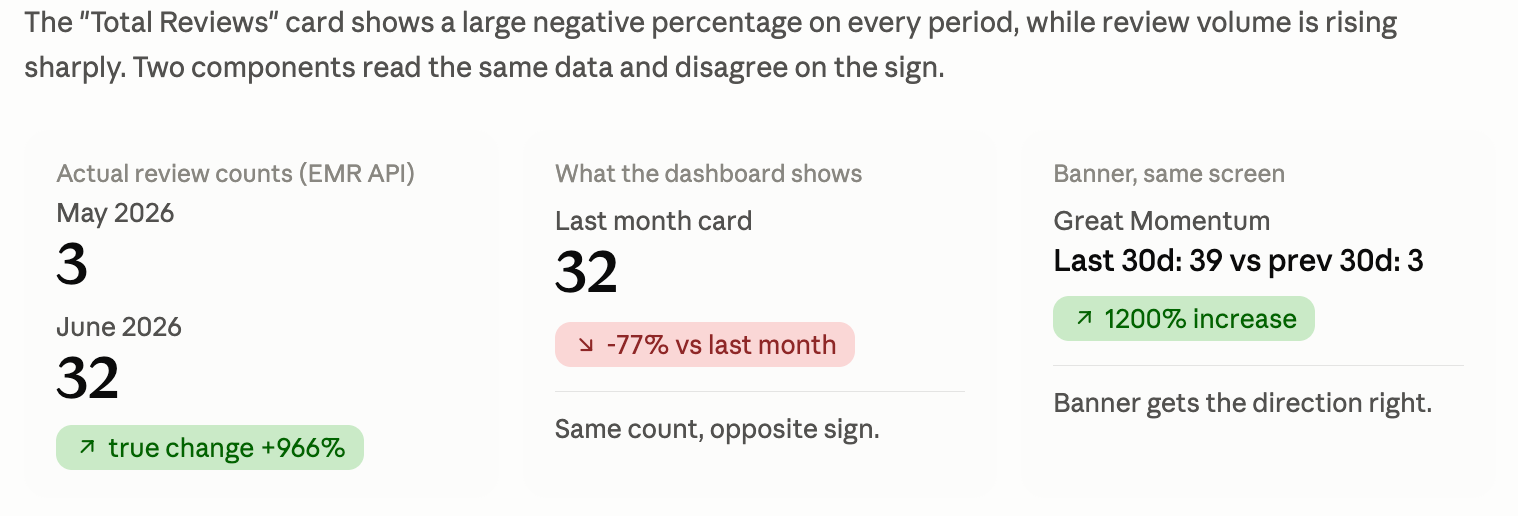
The "% vs last month" delta shown under "Total Reviews" is wrong for every Time Period filter. It displays large negative percentages while the underlying data shows strong positive growth. The sign appears inverted and/or the comparison baseline is incorrect. Notably, the "Great Momentum! You're collecting more reviews than last month" banner in the same UI shows the correct positive direction, so two components are reading the same data with opposite results.
Ground-truth data (from API)
Monthly review counts, 2026:
Jan: 1
Feb: 4
Mar: 1
Apr: 0
May: 3
Jun: 32
Jul (1-6): 7
Correct month-over-month delta, June vs May: +966% (32 vs 3). This matches the "Great Momentum! / 1200% increase" banner (Last 30 Days: 39 vs Previous 30 Days: 3), which uses the correct direction.
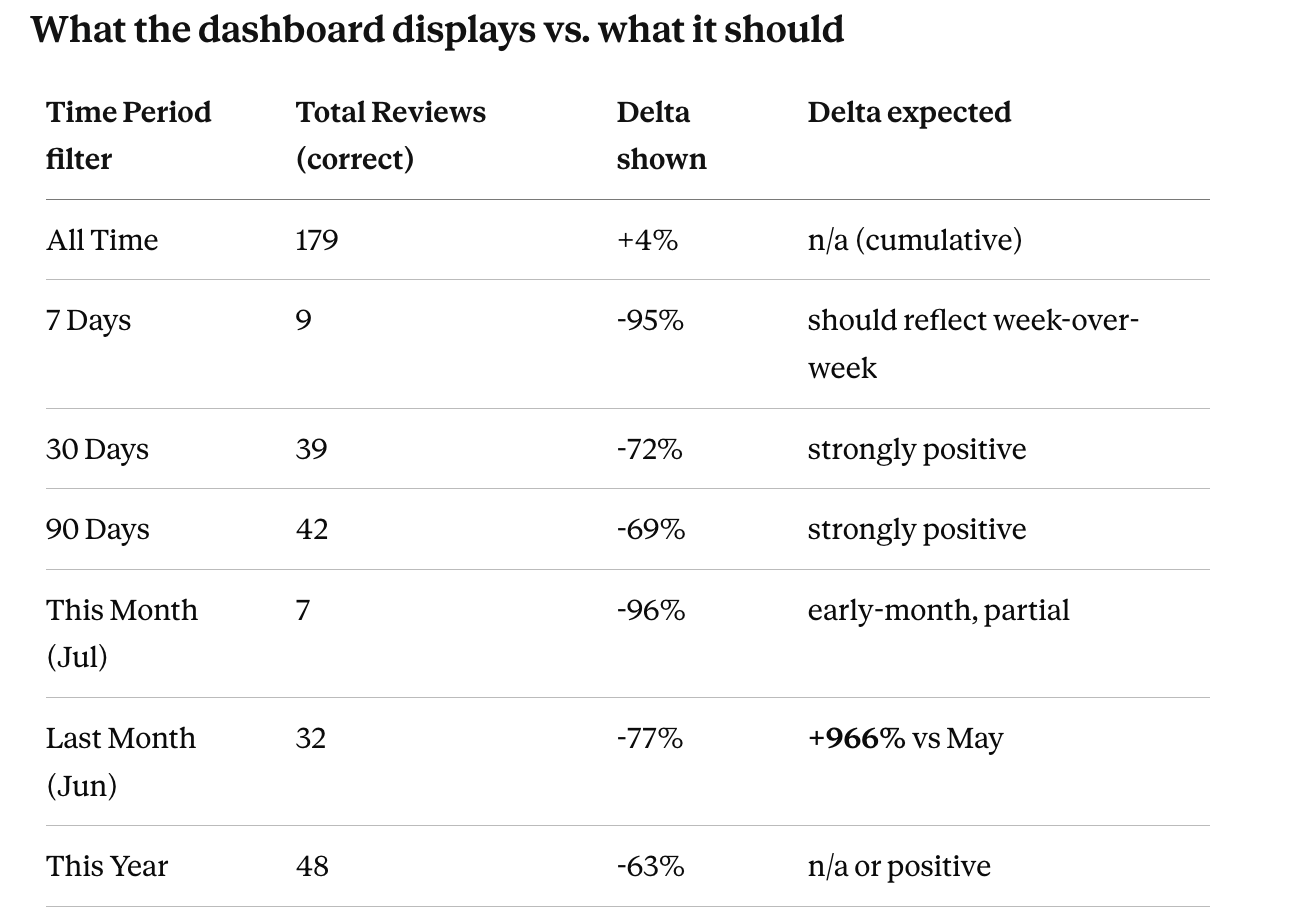
Every windowed filter returns a large negative delta even though review volume is up sharply. The "Last Month" case is the cleanest proof: June had 32 reviews, May had 3, so the true delta is +966%, but the card shows -77%.
Suspected root cause
Two candidate hypotheses, likely combined:
Baseline mismatch. The delta seems to compare the selected period's total against a fixed/rolling reference (possibly a full historical month or an average), rather than against the equivalent immediately-preceding window. When the current window is short (7 Days, This Month-to-date) or the baseline month is unusually high, the result is a spurious large negative number.
Sign / direction handling. In at least the "Last Month" case, the magnitude and sign are inconsistent with the raw counts, suggesting the operands in (current - previous) / previous are inverted or swapped. The banner logic gets this right; the "Total Reviews" card does not.
Note also a second, separate data discrepancy worth confirming: the API reports 48 reviews at avg 5.0 for 2026 YTD (This Year), while All Time shows 179 reviews at 4.6. This is expected if the 179 includes older imported Google reviews with lower ratings and the This Year window only covers dated-2026 reviews — but please confirm the delta engine isn't mixing the two review sets (dated vs. imported-without-date) when computing baselines. A baseline drawn from the full 179 set while the current window uses only dated reviews would also produce false negatives.
How this hypothesis was reached (via EMR MCP)
Reasoning path, for transparency on what is proven versus assumed:
Observation: the "Total Reviews" card shows a negative percentage on every time period filter, while review volume is rising. On "Last Month" it reads -77%, yet June had 32 reviews vs 3 in May, i.e. +966%.
A percentage change is (current - baseline) / baseline. The "current" figure on the card matches the real counts, so the error is unlikely to be in the numerator. That points to the baseline.
Queried the EMR MCP for raw data on this location. It returned: monthly counts Jan 1, Feb 4, Mar 1, Apr 0, May 3, Jun 32, Jul 7; and This Year = 48 reviews at 5.0 avg vs All Time = 179 at 4.6.
The 48 vs 179 gap is the clue. Most likely the 179 include old Google reviews imported in bulk at onboarding with no per-review date and lower ratings. Any time-window filter can only count dated reviews, so the current period sees only the smaller dated set.
Combined hypothesis: current period counts dated reviews only (small recent number), while the baseline is built from the full All Time set (179, inflated by undated imports). Small numerator over large baseline produces a negative percentage on every window, which is exactly what is observed.
Status of this hypothesis: the MCP proves the facts (June 32 vs May 3 = +966% shown as -77%; 48/5.0 vs 179/4.6). The mechanism is a conjecture, since the delta engine's code is not visible from the MCP. Two alternative causes remain open: an inverted sign in the formula, or a baseline locked to a wrong reference month. The import-vs-dated hypothesis is favored only because it explains the negative across all windows at once, not because it is confirmed.
Steps to reproduce
Open Overview for org 95 / location 124.
Select "Last Month".
Observe "Total Reviews" = 32, sub-label "-77% vs last month".
Cross-check via API: June = 32 reviews, May = 3 -> true delta +966%.
Expected behavior
The "vs last month" delta should compare the selected period's total to the equivalent preceding period of the same length (or, for named-month filters like "Last Month", the calendar month immediately before), using (current - previous) / previous, and match the direction already shown by the "Great Momentum" banner.
Log in to comment and vote
No comments yet
Be the first to share your thoughts.